The World Meteorological Organization (WMO) has released a comprehensive assessment report titled “The State of Our Planet,” featuring six charts that encapsulate key aspects of global environmental health.
Global Temperature Trends
Description: This chart illustrates the steady increase in global temperatures over the past century, highlighting the exacerbation of heatwaves, droughts, and extreme weather events.
Implications: Rising temperatures have profound impacts on ecosystems and human societies worldwide.
Carbon Dioxide Concentration
Description: This chart focuses on the concentration of carbon dioxide (CO2) in the atmosphere, a major contributor to climate change.
Implications: Despite mitigation efforts, CO2 levels remain alarmingly high, fueling the greenhouse effect and its adverse effects on the environment.
Biodiversity Decline
Description: This chart depicts the decline of biodiversity in both terrestrial and marine ecosystems, emphasizing the acceleration of species extinction rates.
Implications: Urgent conservation efforts and sustainable land management practices are needed to address this concerning trend.
Ocean Health
Description: This chart highlights the increasing pressures on ocean health, including pollution, overfishing, and ocean acidification.
Implications: These stressors endanger marine biodiversity and disrupt ecosystems critical for various species, including humans.
Extreme Weather Events
Description: This chart visually represents the growing frequency and intensity of extreme weather events worldwide, such as hurricanes, wildfires, and floods.
Implications: Communities face heightened risks and vulnerabilities due to climate change-induced extreme weather phenomena.
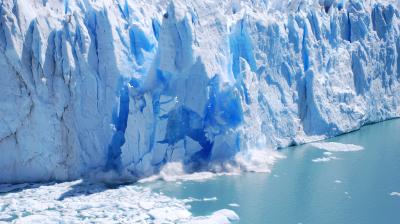
Glacier and Ice Cap Retreat
Description: This chart documents the rapid retreat of glaciers and ice caps, contributing to rising sea levels and posing threats to low-lying coastal areas.
Implications: The shrinking of icy reservoirs underscores the ongoing impacts of climate change on Earth’s physical systems.
Multiple Choice Questions (MCQ):
- What does the first chart in the WMO report primarily illustrate?
- A) Decline in biodiversity
- B) Increase in global temperatures
- C) Concentration of carbon dioxide
- D) Health of oceans
- Answer: B) Increase in global temperatures
- Which environmental factor is highlighted in the second chart?
- A) Ocean health
- B) Extreme weather events
- C) Biodiversity decline
- D) Carbon dioxide concentration
- Answer: D) Carbon dioxide concentration
- What is emphasized in the chart depicting ocean health?
- A) Overfishing
- B) Glacial retreat
- C) Rising sea levels
- D) Species extinction rates
- Answer: A) Overfishing
- Which phenomenon is not illustrated in the charts?
- A) Droughts
- B) Tsunamis
- C) Hurricanes
- D) Wildfires
- Answer: B) Tsunamis
- What is the primary implication of glacier and ice cap retreat?
- A) Decrease in extreme weather events
- B) Reduction in sea levels
- C) Threat to coastal areas
- D) Increase in biodiversity
- Answer: C) Threat to coastal areas